John Gorlow
| Apr 09, 2024

Investors had a terrific Q1. But a third of the way through April, the mood may be changing. While investors remain generally optimistic, they are also watchful as high-flying tech stocks show some signs of deflating. A headline that caught my eye today: “Nvidia has entered correction territory. Apple was already there” (MarketWatch, 9-April). For some months, there has been speculation that we are in a tech Bubble, defined as a period in which stock prices are driven wildly high, completely unmoored from economic fundamentals. And yet we are not witnessing the rabid frenzy we saw back in 2000, when day-trading seemed to be a sideline for everyone with a brokerage account.
Today any worries about a Bubble are focused on AI-related and tech stocks, which have been largely responsible for the superb performance of the S&P 500 index. But those concerns should be viewed in context. Recent research by Goldman Sachs (reported in The Economist, 16-March 2024) analyzed the valuations of the ten biggest stocks in America’s S&P 500 Index. “With prices at an average of 25 times their expected earnings for the coming year, they are on the expensive side. But they are cheaper than they were last year, and a bargain compared with the peak of the dotcom bubble, when prices were 43 times earnings.” The same article notes that the kind of euphoria associated with bubbles is largely absent in the banking industry, whose reckless habits ushered in the Great Recession and decimated the world economy from late 2007 through 2009.
Right now, investors do not appear to be in a reckless mood. That may change after interest rates begin to fall again. But the Fed is also being cautious and careful, trying not to derail the soft landing that began to materialize after skyrocketing inflation soured the investment landscape in 2022.
I encourage you to remain broadly diversified. Continue to allocate investments based on your long-term strategy, taking appropriate risks necessary to meet your goals. Don’t fixate on top-ten or “magnificent seven” tech giants who have dominated the S&P 500. These headliner names are likely to change and change again. “Even the biggest companies have uncertain futures, highlighting the need for broadly diversified investments,” writes Wes Crill, Senior Investment Director and Vice President, Dimensional Fund Advisors.
Now let’s look at the quarter just ended.
Q1 2024 Market Review
Global equities started the year with a bang, returning 8% in the first quarter. The prospect of an AI-driven productivity boom drove stocks higher, especially in the U.S., outweighing uncertainties such as higher-for-longer interest rates and upcoming U.S. elections. Amid persistent inflation and generally healthy economic data, yields rose and bond returns declined. Japan made headlines as the Nikkei reached new record highs for the first time since 1989. Major U.S. indexes, including the Russell 3000 and S&P 500 Index, ended the quarter at all-time highs.
IT and Communication Services stocks led market gains, but weren’t concentrated in the “Magnificent 7” names that led the U.S. market last year. While Nvidia, Microsoft, Meta and Amazon all contributed to market returns, both Apple and Tesla lost ground for the quarter. REITs were the only sector to post negative returns for the quarter, falling after a strong fourth quarter last year.
Globally, value stocks trailed growth stocks and small caps trailed large caps. Higher-profitability stocks generally outperformed their lower-profitability counterparts, offering a buffer against these negative premiums. 1

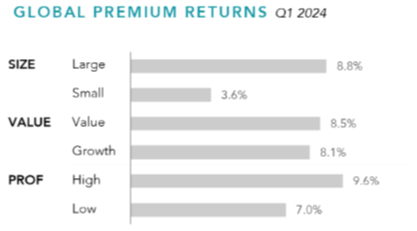
First Quarter 2024 Index Returns
US Stocks (63% of World Market Capitalization) 2
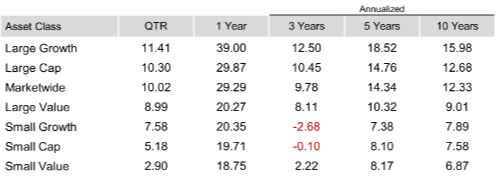
The US equity market posted positive returns for the quarter and outperformed both non-US developed and emerging markets.
Value underperformed growth.
Small caps underperformed large caps.
REIT indices underperformed equity market indices.
US Ranked Returns (%) Q1 2024
 >
>
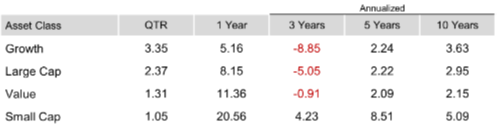
US Period Returns (%) Q1 2024
International Developed Stocks (27% of World Market Cap) 3
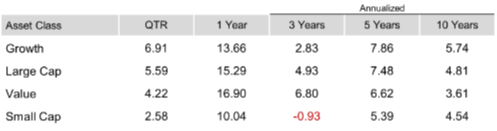
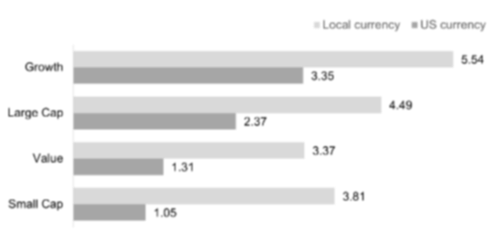
Developed markets outside of the US posted positive returns for the quarter and underperformed the US market, but outperformed emerging markets.
A strengthening dollar detracted from un-hedged foreign returns.
Global stocks have historically had similar long-term returns whether hedged or unhedged. Hedged investment strategies seek to reduce the impact of currency fluctuations on investment returns.
Value underperformed growth.
Small caps underperformed large caps.
International Developed Ranked Returns (%) Q1 2024

International Developed Period Returns (%) Q1 2024
Emerging Markets Stocks (10% of World Market Cap) 4
Emerging markets posted positive returns for the quarter and underperformed both US and non-US developed markets.
Value underperformed growth.
Small caps underperformed large caps.
Emerging Market Ranked Returns (%) Q1 2024
Emerging Market Period Returns (%) Q1 2024
Real Estate Investment Trusts (REITs) 5
US real estate investment trusts outperformed non-US REITs during the quarter.
Real Estate Period Returns (%) Q1 2024

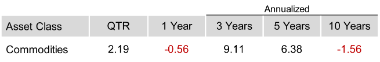
Commodities 6
The Bloomberg Commodity Total Return Index returned +2.19% for the first quarter of 2024.
Unleaded Gas and Low Sulfur Gas Oil were the best performers, returning +17.18% and +16.62% during the quarter, respectively.
Natural Gas and Wheat were the worst performers, returning -29.65% and -11.24% during the quarter, respectively.
Commodity Period Returns (%) Q1 2024
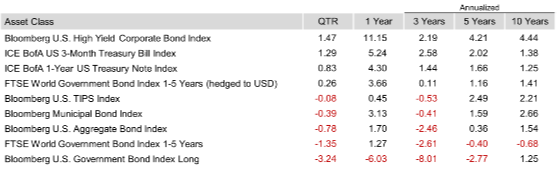
Fixed Income 7
Interest rates generally increased in the US Treasury market for the quarter.
Despite advancing in March, U.S. bonds broadly declined for the quarter. Amid persistent inflation and generally healthy economic data, Treasury yields rose for the quarter.
The Bloomberg U.S. Aggregate Bond Index returned 0.92% in March. But this return wasn’t sufficient to offset earlier declines, and the index returned negative -0.78% for the quarter.
Treasury yields rose in the quarter, with the 10-year note ending March at 4.21%, 33 bps higher than December 31. The two-year Treasury yield climbed 38 bps to 4.63%, and the yield curve remained inverted.
Credit spreads tightened for the quarter, and corporate bonds outperformed Treasuries. MBS outperformed Treasuries in March but lagged modestly for the quarter. High-yield corporates advanced for the month and quarter.
The Fed held rates steady at the quarter’s two monetary policy meetings. And policymakers maintained their forecast for three rate cuts this year against a backdrop of upbeat economic data and inflation still running above the 2% target.
Headline CPI grew at an annualized pace of 3.2% in February, up slightly from January but down from 3.4% in December. Annual core CPI inched lower in February to 3.8%, compared with 3.9% in January and December. The annual core PCE inflation rate, the Fed’s preferred inflation gauge, slowed to 2.8% in February.
Municipal bonds were flat in March and down slightly for the quarter. They lagged Treasuries in March but outperformed in the quarter.
Inflation expectations increased during the quarter, and TIPS outperformed nominal Treasuries.
Fixed Income Period Returns (%) Q1 2024
Do you have questions about your portfolio, asset allocation, or some aspect of your financial plan? Call us. We are here to help.
Regards,
John Gorlow
President
Cardiff Park Advisors
888.332.2238 Toll Free
760.635.7526 Direct
760.271.6311 Cell
Footnotes
- Past performance is not a guarantee of future results. Indices are not available for direct investment. Index performance does not reflect the expenses associated with the management of an actual portfolio.
- Dimensional Fund Advisors LP is an investment advisor registered with the Securities and Exchange Commission.
Market segment (index representation) as follows: US Stock Market (Russell 3000 Index), Developed ex US Stocks (MSCI World ex USA IMI Index [net div.]), Emerging Markets (MSCI Emerging Markets IMI Index [net div.]), US Bond Market (Bloomberg US Aggregate Bond Index), and Global Bond Market ex US (Bloomberg Global Aggregate ex-USD Bond Index [hedged to USD]), Global Stock Market (MSCI All Country World IMI Index [net div.]).
Sector returns are derived by Dimensional using constituent data from the MSCI All Country World IMI Index. Returns for specific securities are sourced from the MSCI All Country World IMI Index using daily security returns. Securities without a GICS sector are excluded. Sectors are classified according to GICS Industry code. GICS was developed by and is the exclusive property of MSCI and S&P Dow Jones Indices LLC, a division of S&P Global. S&P data © 2024 S&P Dow Jones Indices LLC, a division of S&P Global. All rights reserved.
Frank Russell Company is the source and owner of the trademarks, service marks, and copyrights related to the Russell Indexes. MSCI data © MSCI 2024, all rights reserved.
Bloomberg data provided by Bloomberg. Indices are not available for direct investment. Index performance does not reflect the expenses associated with the management of an actual portfolio.
References to specific company securities should not be construed as a recommendation or investment advice.
Global Premium Returns are computed from MSCI All Country World IMI Index published security weights and Dimensional computed security returns and Dimensional classification of securities based on size, value, and profitability parameters. Within the US, Large Cap is defined as approximately the largest 90% of market capitalization in each country or region; Small Cap is approximately the smallest 10%. Within the non-US developed markets, Large Cap is defined as approximately the largest 87.5% of market capitalization in each country or region; Small Cap is approximately the smallest 12.5%. Within emerging markets, Large Cap is defined as approximately the largest 85% of market capitalization in each country or region; Small Cap is approximately the smallest 15%. Designations between value and growth are based on price-to-book ratios.
Value is defined as the 50% of market cap with the lowest price-to-book ratios by size category and growth is the highest 50%. Profitability is measured as operating income before depreciation and amortization minus interest expense scaled by book.
High profitability is defined as the 50% of market cap with the highest profitability by size category and low profitability is the lowest 50%. REITs and utilities, identified by GICS code, and stocks without size, relative price, or profitability metrics are excluded from this analysis.
Countries not in the Dimensional investable universe are excluded from the analysis. Their performance does not reflect the expenses associated with the management of an actual portfolio.
This information is intended for educational purposes and should not be considered a recommendation to buy or sell a particular security. Named securities may be held in accounts managed by Dimensional.
- Market segment (index representation) as follows: Marketwide (Russell 3000 Index), Large Cap (Russell 1000 Index), Large Value (Russell 1000 Value Index), Large Growth (Russell 1000 Growth Index), Small Cap (Russell 2000 Index), Small Value (Russell 2000 Value Index), and Small Growth (Russell 2000 Growth Index). World Market Cap represented by Russell 3000 Index, MSCI World ex USA IMI Index, and MSCI Emerging Markets IMI Index. Russell 3000 Index is used as the proxy for the US market. Dow Jones US Select REIT Index used as proxy for the US REIT market. MSCI data © MSCI 2024, all rights reserved. Frank Russell Company is the source and owner of the trademarks, service marks, and copyrights related to the Russell Indexes.
- Market segment (index representation) as follows: Large Cap (MSCI World ex USA Index), Small Cap (MSCI World ex USA Small Cap Index), Value (MSCI World ex USA Value Index), and Growth (MSCI World ex USA Growth Index). All index returns are net of withholding tax on dividends. World Market Cap represented by Russell 3000 Index, MSCI World ex USA IMI Index, and MSCI Emerging Markets IMI Index. MSCI World ex USA IMI Index is used as the proxy for the International Developed market. MSCI data © MSCI 2024, all rights reserved. Frank Russell Company is the source and owner of the trademarks, service marks, and copyrights related to the Russell Indexes.
- Market segment (index representation) as follows: Large Cap (MSCI Emerging Markets Index), Small Cap (MSCI Emerging Markets Small Cap Index), Value (MSCI Emerging Markets Value Index), and Growth (MSCI Emerging Markets Growth Index). All index returns are net of withholding tax on dividends. World Market Cap represented by Russell 3000 Index, MSCI World ex USA IMI Index, and MSCI Emerging Markets IMI Index. MSCI Emerging Markets IMI Index used as the proxy for the emerging market portion of the market. MSCI data © MSCI 2024, all rights reserved. Frank Russell Company is the source and owner of the trademarks, service marks, and copyrights related to the Russell Indexes.
- Number of REIT stocks and total value based on the two indices. All index returns are net of withholding tax on dividends. Total value of REIT stocks represented by Dow Jones US Select REIT Index and the S&P Global ex US REIT Index. Dow Jones US Select REIT Index used as proxy for the US market, and S&P Global ex US REIT Index used as proxy for the World ex US market. Dow Jones and S&P data © 2024 S&P Dow Jones Indices LLC, a division of S&P Global. All rights reserved.
- Commodities returns represent the return of the Bloomberg Commodity Total Return Index. Individual commodities are sub-index values of the Bloomberg Commodity Total Return Index. Data provided by Bloomberg.
- Bloomberg US Treasury and US Corporate Bond Indices.
- Bloomberg Municipal Bond Index.
- One basis point (bps) equals 0.01%. Yield curve data from Federal Reserve. State and local bonds and the Yield to Worst are from the S&P National AMT-Free Municipal Bond Index. AAA-AA Corporates represent the ICE BofA US Corporates, AA-AAA rated. A-BBB Corporates represent the ICE BofA Corporates, BBB-A rated. Bloomberg data provided by Bloomberg. US long-term bonds, bills, inflation, and fixed income factor data © Stocks, Bonds, Bills, and Inflation (SBBI) Yearbook™, Ibbotson Associates, Chicago (annually updated work by Roger G. Ibbotson and Rex A. Sinquefield). FTSE fixed income indices © 2024 FTSE Fixed Income LLC, all rights reserved. ICE BofA index data © 2024 ICE Data Indices, LLC. S&P data © 2024 S&P Dow Jones Indices LLC, a division of S&P Global. All rights reserved. Bloomberg data provided by Bloomberg.
- Magnificent 7 include Alphabet, Amazon, Apple, Meta, Microsoft, Nvidia, and Tesla.